Re: Macro/Geopolitics/Investing - The Energy Achilles' Heel of America.
A confluence of factors, led by ESG mandates of the last decade, has created an Energy Achilles' Heel for America, and the AI race may end up being one of the key arrows in that Heel.
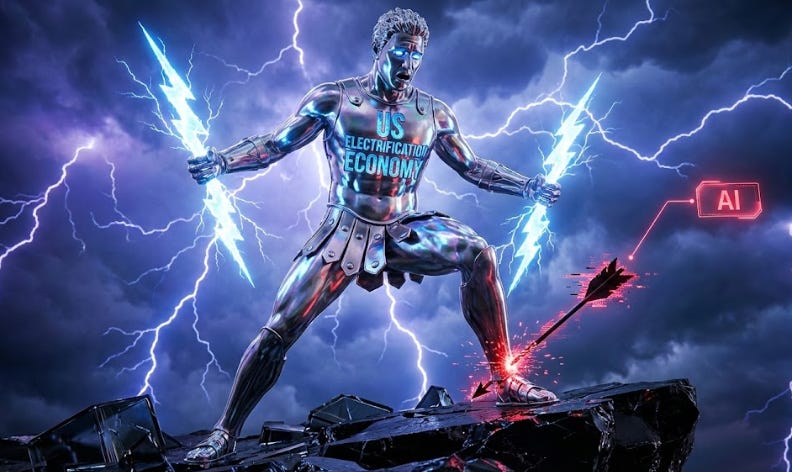
A confluence of factors, led by ESG mandates of the last decade, has created an Energy Achilles’ Heel for America, and the AI race may end up being one of the key arrows in that Heel.
Achilles, the mythical Greek hero of the Trojan War, was the son of Peleus, a mortal king, and Thetis, a sea nymph. To give Achilles invulnerability, Thetis dipped the infant into the River Styx, but because she held him by his heel, the magical waters never touched his heel and left him vulnerable in that spot — hence the origin of the term Achilles’ Heel.
After a decade and over $10T spent globally (and counting) on electrifying our economy to ostensibly make our economy less dependent on hydrocarbons, I find it ironic and worrisome that we find ourselves on both more geopolitically fragile ground and on a potential collision course with an AI-catalyzed energy crunch domestically.
The Gretaverse has actually created an Energy Achilles’ Heel for America.
Electrification & Decarbonization: Solving for the Wrong Variable?
For years, I have thought that the massive wave of ESG-related spending, incentivized by the hysterical siren song of the Climate Catastrophists, was predicated on faulty measures of ROI at best and fundamentally flawed premises at worst.
In late 2019/early 2020, I did a deep-dive on the topic of Anthropogenic (“man-made”) Global Warming to apolitically examine the evidence and proposed solutions. I engaged several primary sources over the course of several months (most notably the chair emeritus of Penn’s Earth Science department) to research this piece.
I highly recommend a read:
Here is a snippet:
What if we have been solving for the wrong variable, namely the reduction of atmospheric carbon, in the first place?
Reasonable people can agree to disagree on this issue (the Why), but what is indisputable is the poor choice of How:
Even if decarbonization is a valid objective, the path chosen ignored Grid Resilience, Geopolitics, and just basic physics.
Rather than re-litigate the Why (Decarbonize/Electrify) question, let’s just focus for a moment on the What (has been spent) questions:
What has been spent on Electrification and Decarbonization?
What did we get out of it?
Was it money well spent?
As the charts below from JPM show, despite the trillions invested and despite the consistent reduction of fossil fuel share, atmospheric CO2 continues its inexorable march higher without ending the world. As my climate piece suggests, the factors affecting Climate Change over Phanerozoic time-scales (measured across eons) are incredibly complex and multivariate.
In my opinion, it was and still is hubris to assume that one variable measured over just the last 200 years is the right variable to solve for.
Again, reasonable people can agree to disagree on the Decarbonization thesis, but regardless of the ideological differences, the global Energy Cost of Capital is now permanently tied to ESG carbon metrics.
Tabulating figures from the Rhodium Group, BNEF US Factbook, DOE, I estimate that we have spent ~$10T-$15T globally and ~$2T-$3T in the US over a decade re-plumbing the economy toward electricity without a rigorous framing of the Why.
Worse, we electrified first and punted the question of whether the system could handle it later without first considering Geopolitical ramifications as well as downstream considerations for Energy Security.
I have been posing many of these questions for years.
In 2021, I wrote this piece calling into question many of these ESG Electrification / Decarbonization initiatives:
I pointed out the problem with Intermittent Energy Sources like Wind and Solar and still believe to this day that the most efficient battery for solar energy has already been invented by nature — it’s called the Hydrocarbon molecule:
My agenda in this piece covers:
Tradeoffs
Geopolitical Dependency Shifts: OPEC (for Oil) → China (for Rare Earths)
Hydrocarbon Dependency Shifts: Oil → Natural Gas
Grid Resilience
Base Load Generation Capacity
Transmission Capacity
Geopolitical Dependency Shifts: OPEC (for Oil) → China (for Rare Earths)
I have repeatedly pointed out the silliness of trading one Geopolitical Dependency on OPEC (that the Shale Revolution already immunized against) with a potentially more fragile Geopolitical Dependency on China:
I brought this issue up again in my policy paper I presented at West Point in early 2023:
“Energy transitions take many decades, and the West’s blind focus to ESG has strangled investment in hydrocarbons and has left the US and the West in a precarious state of dependency on hostile actors like Russia long before hydrocarbon alternatives can dominate our energy consumption. Even worse, a premature transition to EVs threatens to shift the 40% dependency on OPEC+ (but where the US still commands the leading role in world production at 12.5%) to an 85% dependency on China’s rare earth refining capacity (where the US has de minimus role in production). This is a nonsensical risk/reward tradeoff from a national security and National Power standpoint.”
While it’s true that not all electrification mandates present Rare Earth bottlenecks, many of them do, and it seems unwise to compound a serious existing Geopolitical Dependency.
In 2024, I gave a guest lecture at Denison University on the topic of the Geopolitics of Energy and touched upon the frustrating dualities of US Energy Resource Strengths / Policy Weaknesses vs. China Energy Resource Weaknesses / Policy Strengths:
In this talk, I touched upon the topic of fraying Grid Resilience in the US in terms of our decommissioning of Coal and lagging progress in Nuclear:
Was this ESG money well spent given that:
1. Geopolitical Dependencies shifted from OPEC to China as a result
2. Decarbonizing was probably the wrong variable to solve for in the first place
3. The world’s biggest carbon emitter, China, doesn’t care and is likely benefiting from our self-inflicted predicament now?
Hydrocarbon Dependency Shifts: Oil → Natural Gas
The second big Dependency Shift the ESG mandates have created is the key topic which this piece explores — the shift from Oil Dependency to Natural Gas Dependency.
“So what? We have ample Natural Gas here in North America.” you may retort.
I make the case here that while that may have been true thus far, two factors are likely to create an Energy Achilles’ Heel in the next 5-10 years:
Base Load Generation Capacity
Transmission Capacity
Electricity Demand
From 2005 to 2020, US electricity demand was essentially a flat line (averaging ~0.5% annual growth). We were lulled into a false sense of security by energy efficiency (LEDs, better HVAC).
The next 5-10 years are about to shock the system (pun intended) in a way not seen since the post-WWII industrial boom.
As of late 2025, the consensus among grid operators (FERC) and analysts (BNEF, IEA) has been revised upward for the third year in a row, and we are now looking at a 2.5% to 5.0% annual growth rate in electricity demand over the next decade. To put that in perspective, the US will need to add the equivalent of 15 New York Cities' worth of Peak Load (~160 GW) by 2030.
In early 2024, Michael Cembalest at JPM put out a comprehensive paper entitled “Electravision” on the US Electrification / Decarbonization roadmap. I will be borrowing many of their excellent charts in this piece. I quote:
“The challenges: this would require a ~34% increase in US electricity generation (i.e., the same % increase in power generation that took place from 1993 to 2022, a period of 30 years), a ~400% increase in wind and solar power and enough backup thermal power and battery storage to handle 53% of a much larger grid coming from intermittent renewables. The next few pages walk through each step; all increases in electrification are assumed to be powered by new wind and solar. Electrification makes less sense from a decarbonization perspective if powered by additional natural gas.”
Two points:
Keep in mind that this paper was written well before the mad AI Data Center Land Grab of 2025
File that second bold-faced sentence away, as I think one of the biggest ironies this piece will explore is the transition from Oil Dependency to potential Natural Gas Dependency
If Natural Gas is claiming a growing share of electricity share with flat electricity growth, what happens when electricity growth itself spikes?
“An important caveat: our Electravision scenario assumes that total US energy needs will not change much over the next two decades. Unchanged US energy demand is consistent with the last couple of decades; the energy needs of a growing US population have been offset by improving energy efficiency. However, the rise of AI might change that. One illustrative example: the PJM (mid-Atlantic) region has made sharp increases to projections of future power demand for Dominion Resources, a utility serving 6 million customers in 15 states. These increases are entirely due to an increase in data centers which serve advanced computing/AI needs. Constellation Energy estimates that the AI revolution could require more power in the US than the future electric vehicle fleet.”
US Energy Achilles’ Heel: Electricity Inflation
The US Energy Achilles’ Heel that I foresee stems from the convergence of several simultaneous trends, each of which is significant individually but likely to cause material Electricity Inflation when taken together in a short period of time:
The AI Data Center Race: Data centers are the primary engine. AI Data Centers consumed ~4% of US power in 2024; some DOE estimates project 6.7%-12% by 2028, with the low range exceeding 9% by 2030. These facilities are “high load factor” users—they want 100% power, 24/7. No Intermittent Sources will do.
In addition to rapid load growth from AI Data Centers, ESG Electrification & Decarbonization initiatives (e.g. electrified heating) collide with a shortage of firm, dispatchable Base Load capacity, driving up capacity prices and long-term Power Purchase Agreements (PPAs) as buyers compete for reliability. While EV growth has stabilized, the conversion of building heat to electric heat pumps is creating “winter peaking” risks in regions that never had them before.
Reliable Base Load Generation Capacity will be challenged by this combination of factors, and Natural Gas increasing looks like the lowest hanging fruit for choice of Reliable Base Load in the short to medium term.
Even when Generation exists, delivering that power requires massive investment in Transmission Infrastructure (lines, substations, and transformers); because regulated utilities earn a return on invested capital, this surge in grid capex expands the rate base and feeds directly into higher retail electricity rates.
To top it all off, Geopolitical concerns over Russia’s invasion of Ukraine have stoked LNG Export Demand. The race to export LNG to Europe in the wake of Russia’s attack on Ukraine is not something that will stop overnight even if peace breaks out.
In a system where Natural Gas increasingly sets the marginal price of power, fuel-cost pass-through mechanisms transmit price volatility (traditionally weather-focused but now exacerbated by LNG exports and Geopolitics) straight into power bills.
The result is structurally higher and more volatile electricity prices, even in the absence of carbon pricing or explicit policy shocks.
Grid Resilience Requires Adequate Reliable Base Load Generation Capacity
Where will we get Reliable Base Load to power this kind of power demand growth over the next 3-5 years?
As Meredith Angwin’s Shorting The Grid explains so well, Grid Resilience depends on Reliable Base Load — increasingly difficult to achieve with all the ESG-mandated additions of Intermittent Energy Sources.
Intermittent Energy Sources create oscillations in Peak Loads which require Peaker Power Plants to fill in gaps created by these intermittent and often unpredictable Peak Loads; therefore, Intermittent Energy Sources can never serve as Reliable Base Load.
There are four sources of Base Load power in the US:
Coal
Geothermal
Nuclear
Natural Gas
Let’s cover each source in turn. (Numbers are collated from Lazard LCOE+ (2024/2025 Editions), EIA Annual Energy Outlook 2025, NREL ATB 2024.)
Coal
As mentioned in my Denison lecture, Coal is a non-starter here in the US because of ESG mandates (even though that is not stopping China at all). Not only are we not building new Coal plants, we are decommissioning existing plants, which puts even more pressure on the other 3 solutions to bridge the gap.
Geothermal
Enhanced Geothermal Systems (EGS) is a relatively new but promising technology that uses fracking techniques to create "radiators" deep in the earth. Theoretically, EGS can provide Base Load power anywhere, not just in volcanic regions; practically speaking, this is still a nascent technology that is being predominantly tested in the Western US like Texas and Nevada, where Oil & Gas drilling crews are being repurposed to tap these geothermal pockets.
EGS faces several hurdles: 4-7 year development timelines, subsurface risks, high upfront capital costs of $4000-$6000 per kW, and relatively high unsubsidized Levelized Costs of Energy (LCOE) of $65-$110/MWh.
Nuclear
I’ve always thought that Nuclear represents the Holy Grail of Base Load, because Nuclear is the only energy source currently that can supplant hydrocarbons from an energy density/non-intermittency standpoint.
However, Nuclear faces NIMBYism (Not In My Back Yard syndrome) in the extreme, 8-12+ year development timelines, very high upfront costs ($7000-$10000 per kW) and LCOEs of $135-$200/MWh. Even the first commercial deployments of SMRs (Small Modular Reactors) are not expected until 2028-2030. Only life extensions of existing plants appear competitive from a cost and time perspective.
It seems that America’s “Nuclear Renaissance” is always around the corner.
Natural Gas
Taking into account the brutal realities of the forward looking energy landscape, the highest probability source of new Base Load power in the short to medium term in the US is Natural Gas (specifically Combined Cycle Gas Turbines, or CCGTs):
Shortest Time to Market (3–5 Years): A modern CCGT plant can be permitted and built in under 5 years. By comparison, even the most optimistic SMR timelines are pushing into the 2030s.
High Resource Availability: The US is sitting on a century of Natural Gas supply, not even counting access to Canada’s similarly prodigious resources. That said, both current prices and regulatory obstacles prevent this resource from being unleashed en masse. In my opinion, it will require sustainably higher commodity prices to incentivize enough new production to meet spiking secular demand.
Lowest Costs: CCGTs have the lowest upfront capital costs ($1000-$1200 per kW) and lowest LCOEs at ~$45–$80/MWh. Even with rising equipment costs, Gas remains the most cost-effective way to provide 24/7 power compared to any other source of Base Load.
Nuclear’s loss is also Natural Gas’ gain in some places. From JPM:
“In 2020 and 2021, New York State shutdown Indian Point’s nuclear plants with the intention of replacing its generation with renewable energy. That’s not what has happened so far: three new natural gas plants (Bayonne Energy Center, CPV Valley Energy Center and Cricket Valley Energy Center) have filled the gap along with mostly gas-fired electricity imports from states like Pennsylvania.”
Interestingly, the Northeast, particularly New England, mostly imports LNG from Trinidad and Tobago (!) because:
New York prohibits high-volume hydraulic fracturing (despite the Marcellus extends into upstate New York) and prohibits new pipelines from being built in the state; otherwise, Gas from the Marcellus in Pennsylvania could easily service the New England area.
The Jones Act prevents US-flagged ships to move LNG from our own Gulf Coast!
Grid Resilience Requires Adequate Transmission Capacity
I’ve laid the case out for the coming crunch in Base Load Generation Capacity, but assuming we get past that issue, how do we deliver that electricity?
JPM lays it out starkly:
JPM: “While projects less than 150 miles have been completed in 5-10 years, projects more than 400 miles (e.g., from Wichita to St Louis) can require 15-20 years to complete.”
The time required to build out transmission lines here in the US is a major bottleneck. This will also lead to increased electricity prices for the US consumer as the buildout costs will be passed through in the form of higher rates. Rising Natural Gas input prices + Transmission buildout pass-throughs will be a double-whammy for the US consumer.
I hope the Trump Administration can deregulate and solve for this Transmission bottleneck, because this chart really scares me:
Transformers are also an integral part of the Transmission infrastructure. But guess what?
“On this page: transformer and other transmission equipment have seen the highest inflation of all producer goods since 2019”
This is what I meant at the outset about the ESG mandates of the Gretaverse solving for the wrong variable and creating the vulnerabilities of the next decade.
Between the two challenges to Grid Resilience, a shortage of Reliable Base Load Generation Capacity and a shortage of Transmission Capacity, I think the chances are high that the US Energy Achilles’ Heel will manifest in substantial Electricity Inflation in the short to medium term.
Natural Gas: The Common Denominator
Natural Gas, in particular, appears poised to benefit from both shortages, because it is both the lowest hanging fruit in terms of Reliable Base Load Generation Capacity as well as the likeliest beneficiary of “behind-the-meter” Data Center co-locations to bypass Transmission bottlenecks.
Let’s explore two major sources of incremental demand for Natural Gas that have arisen in just the last several years:
AI Data Center Base Load Demand
LNG Export Demand
Natural Gas Demand Driver 1: AI Data Center Base Load Demand
Gas currently provides ~43% of US power and is the only Base Load source that can be built fast enough to meet the immediate 5-year demand surge, now being exacerbated by the AI Data Center buildout.
Natural Gas has not only displaced Coal as the main power source in the United States over the last 16 years, its adoption has far outstripped all other sources despite significant subsidized competition from Intermittent Renewables like Solar and Wind.
AI Data Centers require constant uninterrupted power supply, which can only be supplied by Reliable Base Load, which we have discussed.
I believe that Natural Gas is the lowest hanging fruit for Reliable Base Load for AI Data Centers, because:
Large-scale Natural Gas plants can be developed significantly faster than Nuclear.
The United States has a vast, well-developed Natural Gas pipeline network, increasing the speed by which Natural Gas-fired power can be delivered to support data centers.
Natural Gas has a very small carbon emission footprint enabling tech firms to support ESG mandates if they still choose.
Industry can build “behind-the-meter” Natural Gas Generation, bypassing the electric grid to power AI infrastructure. In 2025, we are already seeing some cases of Hyperscalers (Amazon, Google, Meta) bypassing the grid entirely by building Natural Gas plants directly on-site to avoid the 7-year grid interconnection queue.
It’s no surprise that many planned data centers are located near major Natural Gas basins:
The International Energy Agency (“IEA”) recently released its 2025 outlook showing an expectation that power generation over the next five years will include several different types of fuel but will be dominated by Natural Gas.
Chevron recently announced the start of a Final Investment Decision (“FID”) with a West Texas based data center to provide > 3Bcf/d of Natural Gas to generate reliable large-scale power.
The Hyperscaler Hedge
So far, Hyperscalers are hedging their bets across the spectrum of Base Load choices:
Microsoft opted to restart Three Mile Island (Unit 1). By signing a 20-year PPA with Constellation Energy, they effectively underwrote the multi-billion dollar revival of a mothballed reactor.
Amazon (AWS) bought a data center campus directly connected to the Susquehanna Nuclear Plant (Talen Energy). By “plugging in” behind-the-meter, they bypassed the 7-year grid wait and secured 1.9 GW of power.
Google voted for SMRs (Small Modular Reactors). They signed the world’s first corporate agreement to purchase power from a fleet of SMRs (Kairos Power). They are betting on the “manufacturing model” of nuclear to scale by the early 2030s.
Meta is pursuing a “shotgun” strategy. They “voted” for 150 MW of next-gen geothermal in New Mexico (XGS Energy) and another 150 MW project with Sage Geosystems. They are also pursuing Nuclear in Illinois, and they are simultaneously working with Entergy to fast-track new Natural Gas-fired generation in Louisiana to meet immediate demand for their newest AI clusters.
xAI: Elon Musk’s xAI recently deployed 33 Natural Gas turbines to power a Memphis data center, choosing speed to market over the local utility’s slow-moving grid.
The jury is out on whether these massive capital expenditures by the Hyperscalers will pencil out in terms of ROIs. I have many concerns, especially now that prodigious amounts of Debt are being issued to fund this buildout.
I believe that the cost and time-to-market advantages of Natural Gas will come into starker relief as these Hyperscalers feel ROI pressure from the “Debt Governor”:
If we do make it to the other side of this buildout, I think we could be looking at eventual Energy Overbuild situation in 20 years, but that is a long way out:
What could prevent this Cheap Energy Utopia in 20 years?
The difference between the AI Data Center Buildout vs. the Fiber-Optic Buildout of the Dot Com Era is that the physics are different. You can “light up” dark fiber for almost zero marginal cost; you cannot “turn on” a Gas plant or Nuclear reactor without significant fuel and maintenance costs.
Regardless of where we land 15-20 years out, in the short to medium term of the next 3-5 years, it’s hard for me to envisage this AI Data Center Land Grab as anything but positive for Natural Gas Demand in particular.
Natural Gas Demand Driver 2: LNG Export Demand
The story gets even more interesting for Natural Gas, well beyond the AI thesis.
Natural Gas has historically been a provincial “trapped” commodity, moving only where pipelines could transport it. Unlike Oil, which is a global commodity with well-worn arbitrage mechanisms between geographies, Natural Gas has historically not been arbitrageable between geographies because its traditional mode of transportation has been via pipelines, which tend to be landlocked. There are currently multiple benchmark prices (e.g. US Henry Hub, European TTF, Asian JKM) that still trade at very wide differentials due to the lack of arbitrage.
As a result of its provincial nature, Natural Gas prices tended to be characterized by extreme volatility driven by local weather events (which can drive extreme inelasticities from both a Supply and Demand perspective) and less by Macro conditions.
Sometimes known as the “Widow Maker,” Natural Gas trading has claimed its share of traders, and I remember all too well the collapse of Amaranth Advisors in 2006, a hedge fund that cut its teeth in convertible arbitrage (what my firm focused on as well) before it “style-drifted” into the arcane world of Natural Gas trading.
Despite occasional weather volatility, Natural Gas prices have always been low in the US, and for good reason — not only we are we blessed with ample domestic resources, our neighbor Canada has ample domestic resources.
Below is a long-term chart of the US Natural Gas benchmark (Henry Hub). The long-term mean since 1991 when the contract began is $4.37 MMBtu, but that number also averages in the massive cold weather and hurricane spikes of the Pre-Shale 2000’s. The median price during this period is ~$3.35 MMBtu, but the modal cluster has been closer to the $2.50-$2.80 MMBtu range.
Post the Shale Revolution of the 2010’s, even the mean price averaged $2.80 - $3.20 — until the 2020’s.
We have been spoiled into complacency.
LNG Exports Unlock the Global Arbitrage
The largest source of incremental Natural Gas Demand might not even be from AI Data Centers. This chart implies the largest source of incremental demand pull will be from LNG Exports:
Source: EIA, Range Resources, Williams Cos
The US became the largest LNG exporter in 2023, as LNG replaced Russian pipeline Natural Gas since the Russian invasion of Ukraine. This trend is likely to continue even if peace breaks out between Russia and Ukraine, because the Europeans appear to have “found religion” in taking responsibility for not just their own Defense but also their Energy Security.
Current US LNG Export capacity is estimated between 16–18 Bcf/day and is expected to almost double to over 30 Bcf/day by the early 2030’s. This includes expansion of current facilities as well as new facilities under development.
Increased LNG Export demand represents 15% of current domestic Natural Gas production.
Source: EIA, Range Resources
From Provincial Commodity to Global Commodity
Even with the advent of European LNG Demand, there is not yet a global arbitrage due to LNG liquefaction and regasification constraints. While the US already became the world’s largest LNG exporter in 2023, we will likely not have “excess” export capacity until late 2026 and not significant excess export capacity until late 2029. Only when capacity exceeds demand will US prices and global prices begin to "track" each other with a tight correlation, much like Brent and WTI crude.
When Russia invaded Ukraine in early 2022, for example, TTF (the European Natural Gas benchmark) prices skyrocketed on disruptions due to Europe’s self-inflicted dependencies on Russian gas. The inability to arbitrage geographies, however, translated into a relatively muted spike in Henry Hub prices as the relative performance chart below shows:
Even when the arbitrage opens up, there are some significant differences between Natural Gas and Oil:
Higher “Basis Risk”
Basis Risk will always be higher in Gas than in Oil due to the physics of liquefaction.
The “toll” is fixed and high: To move Oil, you just pump it on a ship. To move Gas, you have to chill it to -260°F. This costs roughly $2.50 to $3.50 per MMBtu in “liquefaction and regas” fees.
The Floor vs. Ceiling Dynamic
Henry Hub will likely act as the “Global Floor.” Global prices can’t stay below Henry Hub + $3.00 for long, because US exporters would simply stop shipping (the “shut-in” price), causing a global shortage. Conversely, if global prices spike, they will pull Henry Hub up until US domestic demand (like power plants) starts to “break.”
The arbitrage is not necessarily bi-directional. To understand why, you have to look at the hardware of these facilities. Liquefaction (for exporting) and Regasification (for importing) are two entirely different industrial processes. Most of the famous US terminals (Sabine Pass, Freeport, Cameron) were originally built in the early 2000s as import facilities. When the Shale Revolution hit, these companies didn’t tear them down; they tacked on liquefaction trains to the existing infrastructure. Because of this history, many of the major Gulf Coast terminals are technically bi-directional and still have the old regasification equipment sitting there. If US prices ever spiked so high that it made sense to bring a ship in from Qatar (unlikely, but possible), these specific facilities could theoretically flip the switch and import. However, many of the newer “greenfield” projects like Venture Global’s Plaquemines or the newer phases of Corpus Christi are often designed as export-only facilities. They are optimized for one-way traffic to keep costs down. For these terminals to “work in reverse,” they would require significant capital expenditure to add regasification units and specialized pumps.
I don’t expect a smooth transition to this New Regime at all, but I think we are likely to see a series of higher highs and higher lows — a Secular Bull Market characterized by a rising “sawtooth” with weather volatility continuing but at lower and lower levels as the Global Arbitrage begins to open up by the end of the decade.
There will come a point in time when the Global Arbitrage becomes truly bi-directional, but my guess is that day doesn’t come unless we see a protracted period of global prices falling under the Henry Hub + “Toll” price.
Natural Gas: A New Regime
To summarize, two factors changed in the 2020s that could herald a significant New Regime for Natural Gas, for at least the remainder of this decade:
AI Data Center Demand, which is relatively inelastic due to its high availability/reliability needs, became the latest secular demand pull in the US as there is no other Base Load source that is viable within 3-5 years.
LNG Export Demand from Europe, which found religion after its self-inflicted reliance on Russia, became a significant source of demand pull from North America as Geopolitical Risk reared its ugly head for the first time for the commodity:
How To Benefit From The Energy Achilles’ Heel?
Here are some ideas for investment expressions that address some of the themes covered so far.
Expressions for Natural Gas Base Load Generation
Since Natural Gas (specifically CCGTs) has the shortest “time to market” (3–5 years) and lowest cost ($45–$80/MWh), it is the primary beneficiary of the AI demand surge + LNG Export demand surge.
Dry Gas Producers: Investing in companies with high-quality inventory in the Haynesville in particular. These producers benefit directly from the secular demand pull of AI data centers and the 30% projected increase in total gas demand by 2030. The Haynesville is really the swing producer given its ability to move molecules to market versus many of the other more geographically (and regulatorily) constrained basins.
Midstream Infrastructure (Pipelines): Companies that own and operate the pipes connecting gas basins to power-hungry regions like the Mid-Atlantic (Dominion/PJM) are essential.
LNG Export Pure-Plays: As US Gas transitions from a provincial to a global commodity, companies owning Liquefaction terminals (like Sabine Pass or Corpus Christi) will capture the “toll” of $2.50 to $3.50 per MMBtu required to move gas globally.
Expressions in Transmission Capacity
Transmission is a major bottleneck with project timelines of 15–20 years for long-distance lines.
Electrical Equipment Manufacturers: Investing in the specialized industrial firms that manufacture these long-lead-time components plays into the supply-demand imbalance.
Regulated Utilities in AI Data Center Areas: Focus on utilities in regions where data center demand is forcing massive revisions to power outlooks. These utilities are often allowed to earn a regulated return on the massive capital expenditures required to upgrade their grids.
EPC (Engineering, Procurement, and Construction) Firms: Companies that specialize in the physical build-out of high-voltage transmission lines and substation upgrades.
My issue with these trade expressions is that they’re “noisy” and have many Idiosyncratic risks attached to each expression.
For example, if you’re playing Dry Gas Equities, you’re stacking on Idiosyncratic Capital Structure Risks and Idiosyncratic Capital Reallocation Risks on top of Macro Risks.
If you’re playing Transmission bottlenecks, how do you hedge for the Hyperscaler trend of co-locating Data Centers “behind-the-meter” near Natural Gas basins, thereby bypassing Transmission bottlenecks?
I prefer a purer expression on Natural Gas, which I believe is the common denominator and primary beneficiary of the confluence of all of the trends we have covered.
Minerals: A Pure Expression For a Bullish Natural Gas Thesis
I am choosing the path of Mineral Rights ownership through a fully liquidating Private Minerals Fund structure, which I believe avoids trading volatility, has margin of safety, and retains upside optionality to higher commodity prices.
Minerals Primer
Minerals represent the literal ownership of the Natural Gas and Oil located thousands of feet below the surface. In the US, we have a unique “Split Estate” system where the person who owns the cows and the grass on the surface may not own a single molecule of the Gas beneath them.
Owning Minerals is the “purest” way to play the energy space because you have zero operational risk. You don’t pay for the drilling, you don’t pay for the pipes, and you aren’t liable if a well causes environmental damage. You simply “clip the coupon” on someone else’s capital expenditure. The flip side is that you don’t have control over the cadence of drilling, and of course you also lose on dry holes. Choice of basin is also important, because many basins are geographically and regulatorily constrained. Knowing how to underwrite for these risks is the primary differentiator for Minerals investors.
The primary return and cash flow comes from Royalties (the “coupon clipping” mentioned above). Once Gas starts flowing, you receive a percentage of the gross revenue (typically 12.5% to 25% depending on the lease agreement) before the driller even pays his own bills (except for production taxes).
Under the US Tax Code, Mineral owners can often claim a 15% Percentage Depletion deduction. If you receive $100,000 in Royalty checks, you may be able to shield $15,000 of that from taxes entirely, regardless of your cost basis. It treats the gas like a “depreciating asset,” effectively giving you tax-free cash flow.
My choice of expression also stems from a downside mitigation framework that I strictly follow after learning the lessons from the last protracted bear market in Oil from 2015-2018.
Pros of investing in Minerals:
Minerals represent a “capital light” approach to gaining commodity exposure
High free cash flow margins
No capex or operating costs
Greatest exposure to commodity price
Fragmented ownership by individual landowners presents attractive opportunities for consolidation. There could be hundreds of distinct Mineral holders within a single drilling unit.
Tax advantages from Depletion deduction
No Idiosyncratic Capital Structure risk
No volatility risk from trading futures (although distributions will be correlated to commodity prices)
Cons of investing in Minerals:
No direct input or visibility into development timing
Lack of hedging ability until wells are producing
Uncertainty over operator intentions during commodity downturns
Illiquid, therefore dependent on capital return through distributions
Title Risk: Since Mineral rights can be severed and handed down through generations, a single acre might have had dozens of owners over time, and mitigating Title Risk is extremely important in the underwriting process.
Complexity — it is an arcane field that requires specific expertise. Here is a brief video primer on the different types of Mineral Rights:
Why a Fully Liquidating Private Fund Structure?
I have several key Investment Criteria that this structure fulfills.
First, here’s what I’m looking to avoid:
Volatility Risk: I generally don’t trade futures, since I don’t want to be wed to screens anymore. The weather-driven nature of Natural Gas in particular makes direct futures participation a non-starter for me.
Idiosyncratic Capital Structure Risk: I also don’t like to take Idiosyncratic Capital Structure risks in the commodity sector, because it adds another layer of risk and required due diligence on top of the Macro analysis.
Idiosyncratic Capital Reallocation Risk: I prefer Capital Reallocation decisions to be left to investors instead of management teams, as I have seen bad management teams squander hard-earned cash flow by reinvesting them into suboptimal projects. This is a big reason why I prefer Private / Full Liquidation business models versus Public Equities in the commodity sector. Terrible Capital Reallocation was prevalent during the 2014-2018 Oil Bear Market, and I wrote a detailed piece about the lessons learned from that period.
Here are some of my other Asset Allocation criteria that a fully liquidating Private Minerals Fund structure checks:
Uncorrelated Passive Income: I like to have a portfolio of Passive Income sources that are uncorrelated to broader markets and orthogonal to each other.
Fully Liquidating: A Fully Liquidating model has a built-in Exit Strategy and leaves the Capital Reallocation decision with the investor.
Short Hold Period: I do not like long lockups, and this structure should fully payback in under 3.5 years, with a full exit in 5-6 years.
Margin of Safety: Minerals acquired with a disciplined underwriting process provide downside mitigation from low effective acquisition prices (< $2 MMBtu) for recoverable reserves. This is a KEY criterion for me, because it’s very hard for me to envisage a sustained environment of sub-$2 MMBtu Natural Gas with the ongoing secular tailwinds.
Everyone has different Investment Criteria and different levels of risk appetite. This is just what works for me after considering all of the alternatives for playing this theme.
Conclusion: The Big Irony
We spent the 2010s bringing about the Shale Revolution to overcome our OPEC Oil Dependency:
Not surprisingly, Oil prices have struggled:
We spent the last 5 years arguably solving for the wrong variable with ESG mandates pushing us into a new Geopolitical Dependency with China on Rare Earths, effectively trading Geopolitical Dependency on OPEC in Oil for a more fragile Geopolitical Dependency on China for Rare Earths.
At the same time, that same ESG push for Electrification and Decarbonization has effectively traded off one Hydrocarbon Dependency on Oil for another Hydrocarbon Dependency on Natural Gas, given its combination of lowest upfront and levelized costs and fastest development timelines versus other Base Load choices.
It would not surprise me if the lifetime cost of EV ownership begins to exceed the lifetime cost of Internal Combustion Engine (ICE) vehicle ownership in the next decade if I am right about this shift in Hydrocarbon Dependency.
With rising Natural Gas demand from the AI Data Center Land Grab and possibly an even bigger demand pull from LNG Exports in the wake of the Russia/Ukraine War, it’s hard for me to envisage a protracted period of sub-$2 MMBtu Henry Hub prices in the short to medium term, especially given how difficult it has historically been to sustain sub-$2/MMBtu pricing in the past even without these new demand tailwinds from AI and LNG.
There will continue to be extreme volatility for sure, but I believe it will come in the form of a generally “rising sawtooth.”
The specter of significant Electricity Inflation has not reared its ugly head in the US in a long time, but I fear the confluence of factors I have presented in this piece present a significant Energy Achilles’ Heel in the US Electrified Economy. The least we can do is to start thinking about what kind of boots to wear to protect that Heel!


"The Gretaverse has actually created an Energy Achilles’ Heel for America." I think this was the plan of the Gretaverse, specifically to weaken the hated USA and the west. We (not me) fell for it hook, line and sinker. Somehow they took our superpower - oil and NG and told us that it was evil and that we can't use it. Before that, they managed to kill off the entire nuclear industry and all the research and development for the last 50 years.
The key to our mistake is electrifying first, without a comprehensive plan. Had we made a plan, like modernize the grid, ensure adequate base-load power production (nuclear, coal, gas), then added niceties like wind, solar and geothermal WHERE IT MAKES SENSE, then we would be much better off.
The key metric of the wealth of societies is cheap, reliable power! Look at poverty rates around the world and you will see that nations with abundant, cheap power thrive, while much of the rest of the world lives in squalor.
In the end, I think it was a masterstroke by Russia and China to fund the ESG movement and turn the USA against itself. Think of all that money we chose to allocate prematurely and poorly to "green energy" instead of what we should have done. Oh and lest you blame it all on AI power demand, we were already on this track before that. How convenient that China holds all the REE cards now.
I live in the PMJ grid area and most of our problems here are poor planning and poor choices made by politicians. You know who is hurt by high energy prices? The poor and middle class. I can afford these high prices, but the lower rungs suffer the most. For all the bluster from some politicians that the dreaded billionaires are the cause of all evils, all the politicians need to do is look in the mirror. It is politicians who make nuclear expensive. It is not inherently expensive, it is all the NIMBYism that causes the expense. In China they just build it.
The natural gas dependency angle is what people miss completely when they talk about electrification. Everyone focuses on the clean energy narrative, but the practical reality is we're just shifting from liquid fuels to a different hydrocarbon with tighter supply constraints. Been tracking Haynesville activity since mid-2024 and the producer discipline around sub-$2.50 pricing is totally different than 2010s behavior. The LNG export arb opening up is what changes the game structurally, tho it'll be messy getting there. One thing worth watching is how fast utilities pivot back to gas when SMR timelines keep slipping, because that transmission queue backlog is areal constraint that doesn't get solved with just money.